Dominion Three-Card Monte: How the Election Was Stolen

There are many examples of election fraud throughout the country but one of the most mysterious and potentially widespread is the vote manipulation by the Dominion-Smartmatic-Scytl-Edison system.
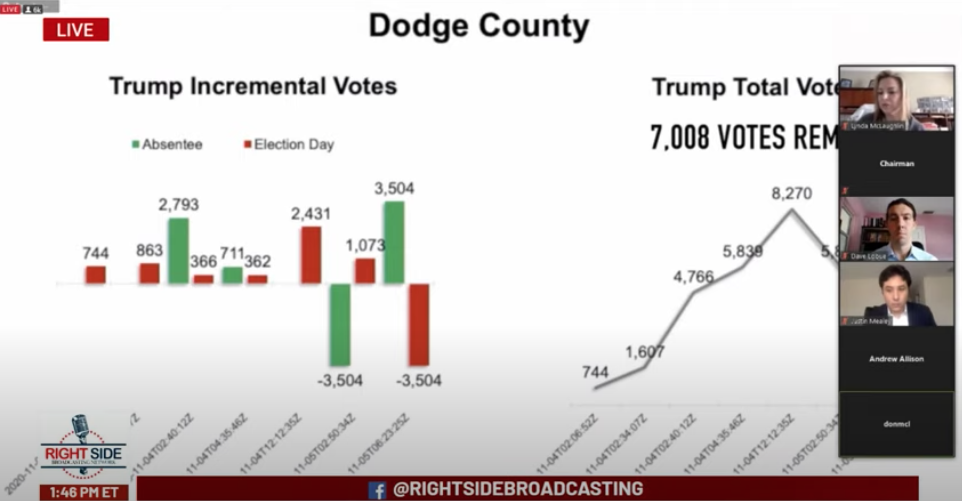
The data from the Edison news feed shows increments and decrements over time. This should not be the case for elections. Each precinct has an integer for each candidate and those should be added to other integers to make a total. But that’s not what happened in the 2020 presidential election.
The fact-checkers have supposedly debunked the claims that votes were switched or deleted, but they don’t give a reason for the decrements in the vote tally, they just say “There is no evidence that any voting system deleted or lost votes, changed votes, or was in any way compromised,” and leave it there. They don’t explain the decrements.
The most notorious vote switch occurred in Antrim County, Michigan where 6,000 votes were switched from Trump to Biden and then switched back. Election officials said that that was caused by human error.
“All ballots were properly tabulated. However, the clerk accidentally did not update the software used to collect voting machine data and report unofficial results.”
“Since the scanners … used slightly different election definitions, some of the positions didn’t line up properly,” J. Alex Halderman, the U-M professor and voting systems expert, said. “As a result, when the results were read by the election management system, some of them were initially assigned to the wrong candidates.”
That raises the questions of why that’s even a possibility and how often did that type of error happen?
Are we to assume that all the decrements across the country are a result of this type of error? There still is no good answer for it.
This analyst thinks that the Edison data came from predictive models, not actual polling data:
Edison Research data is not actual data from the polling stations themselves. It is based on complex mathematical and trend analysis that they use to estimate how polls in counties should be performing on election day. They have pre-generated models of the number of votes each candidate should have received by a particular time of day. These models are generated using as much of the data as they can collect prior to election day.
That seems fairly insane since that’s what news organizations are report specifically as vote totals.
Analysts from the Data Integrity Group have a different understanding of the what these data are reported and explain the Dominion three-card-monte at the Georgia Senate Subcommittee meeting 12/30/20:
They explain how over 30,000 votes were taken away from Trump in three different Georgia counties, which alone resulted in a Biden win.


